Dashboard
The Dashboard is the first page you see when you log into the Admin Portal. It provides a real-time snapshot of everything happening at FundedYouth — student activity, enrollment trends, revenue, upcoming sessions, and more.
At a Glance — Stat Cards
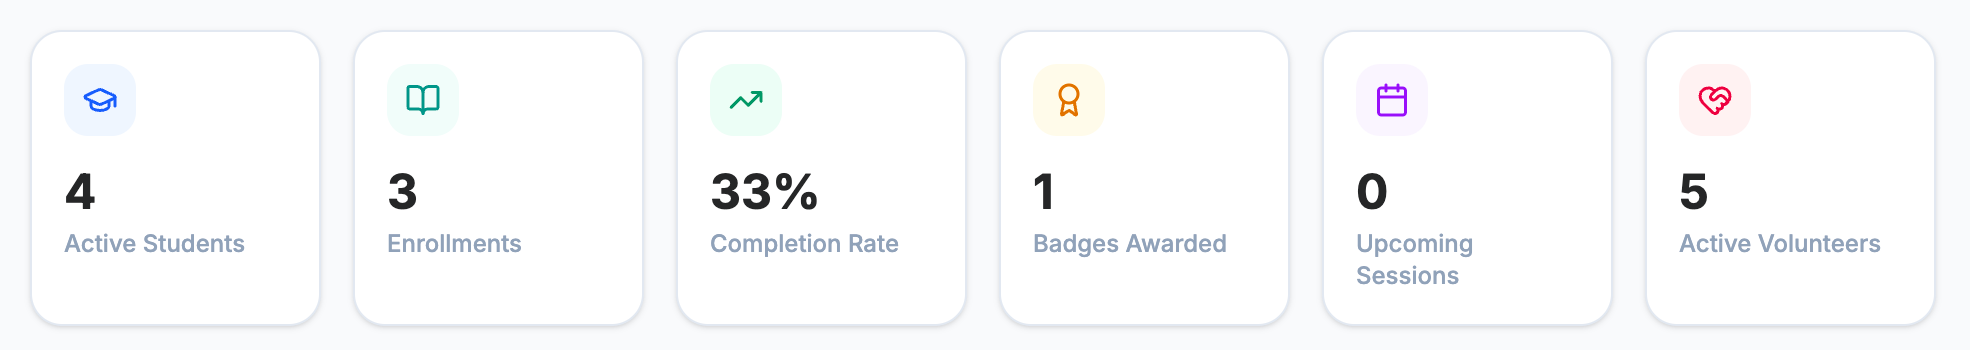
Section titled “At a Glance — Stat Cards”Across the top of the dashboard, six stat cards give you an instant overview of key metrics:
| Card | What It Shows |
|---|---|
| Active Students | Number of students currently enrolled in at least one course |
| Enrollments | Total active course enrollments across all students |
| Completion Rate | Percentage of enrollments that have been completed |
| Badges Awarded | Total number of badges earned by students |
| Upcoming Sessions | Number of sessions scheduled in the future |
| Active Volunteers | Number of volunteers with active status |
These numbers update in real time as students enroll, complete courses, earn badges, and sessions are scheduled.
Charts and Enrollment Status
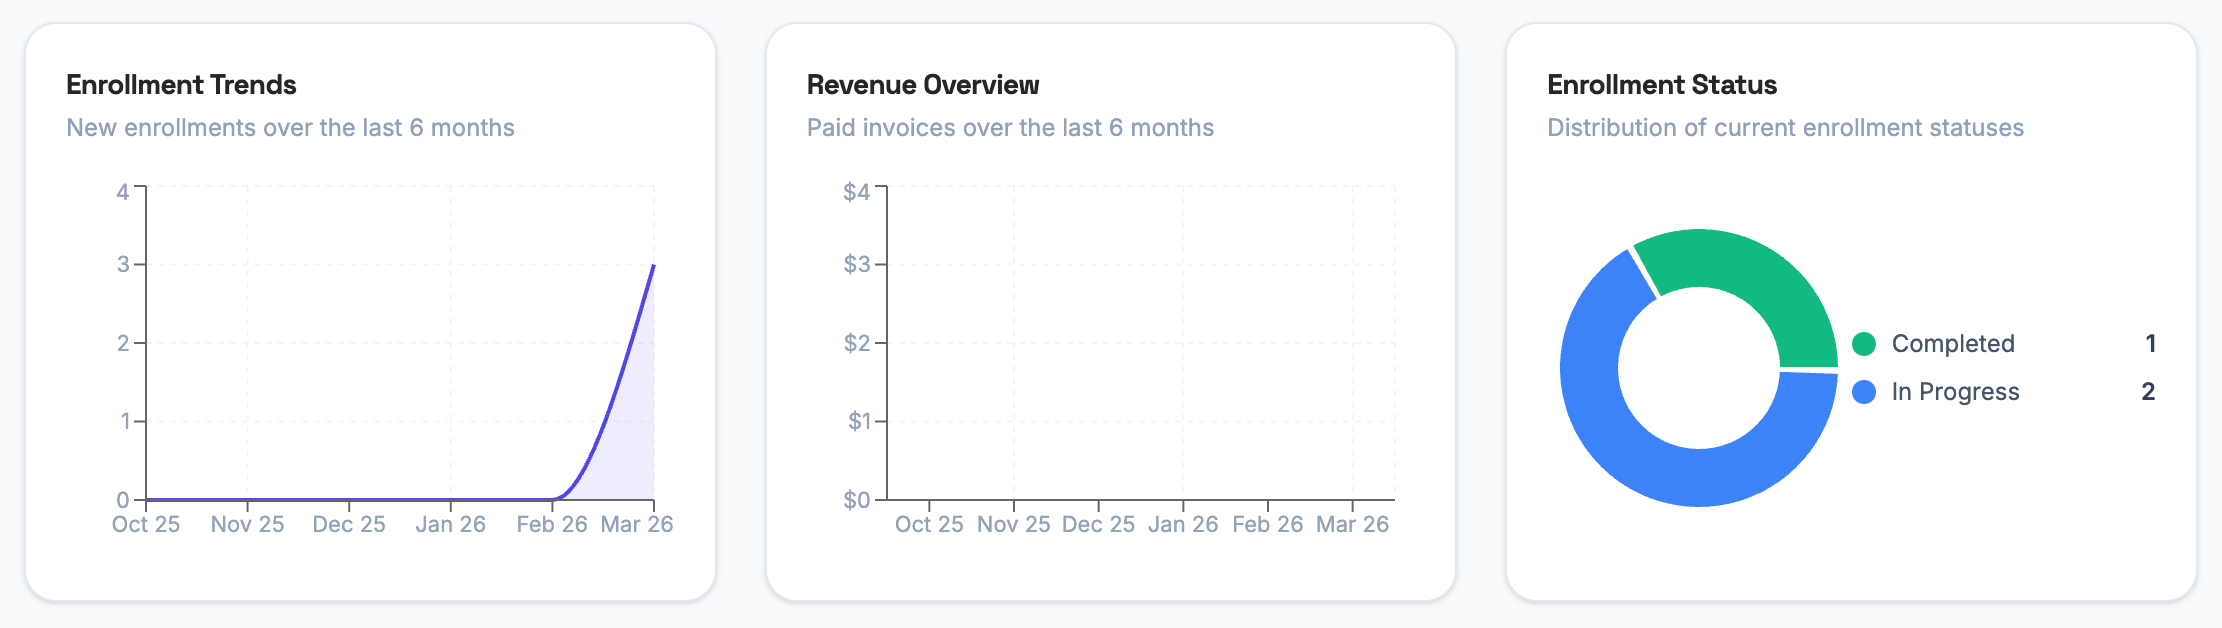
Section titled “Charts and Enrollment Status”Below the stat cards, three panels show trends and distribution data:
Enrollment Trends
Section titled “Enrollment Trends”A line chart showing the number of new course enrollments over the last 6 months. Use this to spot growth or drops in student activity. A rising line means more students are enrolling — a flat or falling line may indicate a need for outreach or new course offerings.
Revenue Overview
Section titled “Revenue Overview”A bar chart showing the total dollar amount of paid invoices over the last 6 months. Each bar represents one month of revenue from membership plans, credit packs, and add-on subscriptions. This helps you track financial performance at a glance.
Enrollment Status
Section titled “Enrollment Status”A donut chart breaking down all current enrollments by status:
- Completed — Students who have finished a course
- In Progress — Students who are actively working through a course
The chart gives you a quick sense of how many students are actively learning versus how many have finished.
Recent Activity
Section titled “Recent Activity”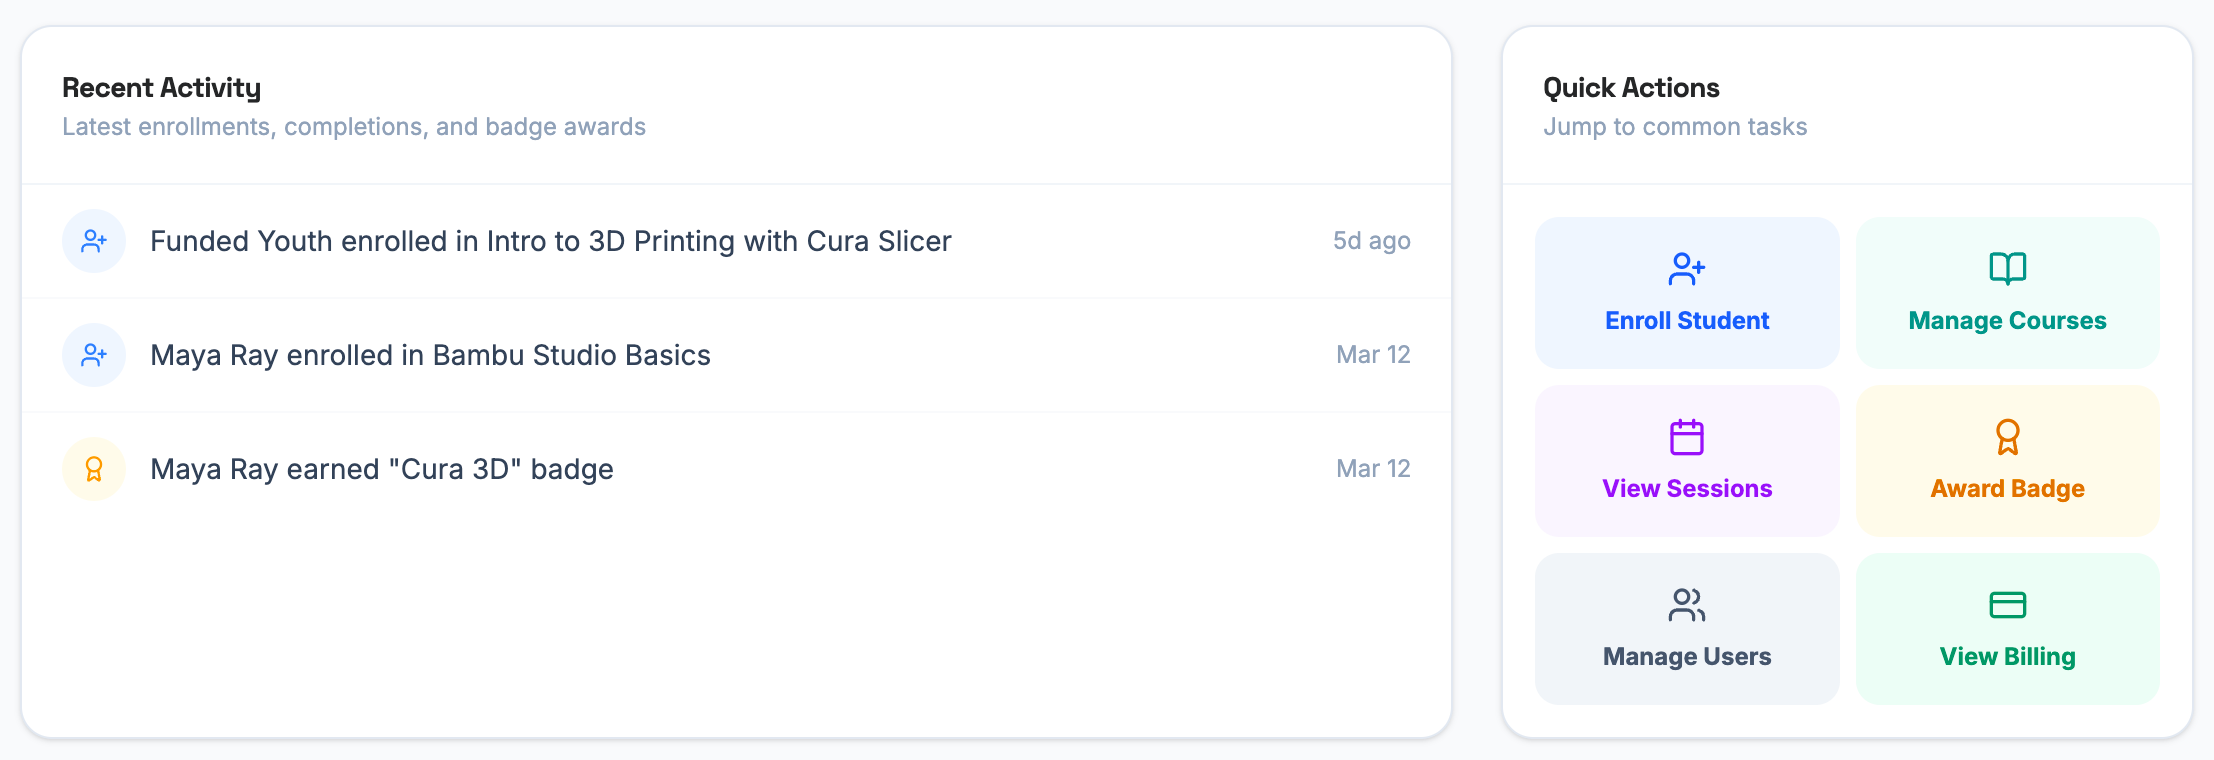
Recent Activity Feed
Section titled “Recent Activity Feed”The left panel shows a chronological feed of the latest events across the platform:
- Enrollments — When a student enrolls in a course (shown with a person icon)
- Badge Awards — When a student earns a badge (shown with a medal icon)
Each entry shows what happened, who was involved, and when it occurred. This feed gives admins a quick pulse on student engagement without needing to navigate to individual sections.
Quick Actions
Section titled “Quick Actions”The right panel provides shortcut buttons to the most common admin tasks:
| Action | Where It Goes |
|---|---|
| Enroll Student | Jump to the student enrollment workflow |
| Manage Courses | Open the course management section |
| View Sessions | See all scheduled and upcoming sessions |
| Award Badge | Manually award a badge to a student |
| Manage Users | Open the user management section |
| View Billing | Check invoices and payment activity |
These are just navigation shortcuts — they take you to the same pages available in the sidebar menu.
Course Completion and Upcoming Sessions
Section titled “Course Completion and Upcoming Sessions”Course Completion
Section titled “Course Completion”Shows courses that currently have active student enrollments, along with their completion rates. If no courses have active enrollments, you’ll see “No active courses.” Click View All to go to the full course management section.
Upcoming Sessions
Section titled “Upcoming Sessions”Shows the next few scheduled sessions. If there are no sessions on the calendar, you’ll see “No upcoming sessions.” Click View All to go to the sessions management section.
Recent Badge Awards
Section titled “Recent Badge Awards”This section shows the most recent badges earned by students. Each entry shows:
| Detail | What It Shows |
|---|---|
| Badge icon | A medal icon representing the badge |
| Badge name | The name of the badge that was earned |
| Student name | Who earned it |
| AUTO badge | If the badge was automatically awarded based on course completion rules (shown as a green AUTO tag). Manually awarded badges show a blue MANUAL tag instead. |
Click View All to see all badges and award history in the Students section.
How the Dashboard Stays Updated
Section titled “How the Dashboard Stays Updated”The dashboard pulls live data from across the portal. When you:
- Enroll a student → The Active Students, Enrollments, and Enrollment Trends numbers update
- A student completes a course → Completion Rate and Enrollment Status donut update
- Award a badge → Badges Awarded count and Recent Badge Awards update
- Schedule a session → Upcoming Sessions count and section update
- Process a payment → Revenue Overview bar chart updates
- A volunteer is approved → Active Volunteers count updates
You don’t need to refresh the page manually — the dashboard reflects the current state of the system each time you visit.
Next Steps
Section titled “Next Steps”- Learn about User Management in the Admin Portal
- See how Sessions work from the user’s perspective
- Review Billing to understand invoices and payments